

Map of the area modeled in this study
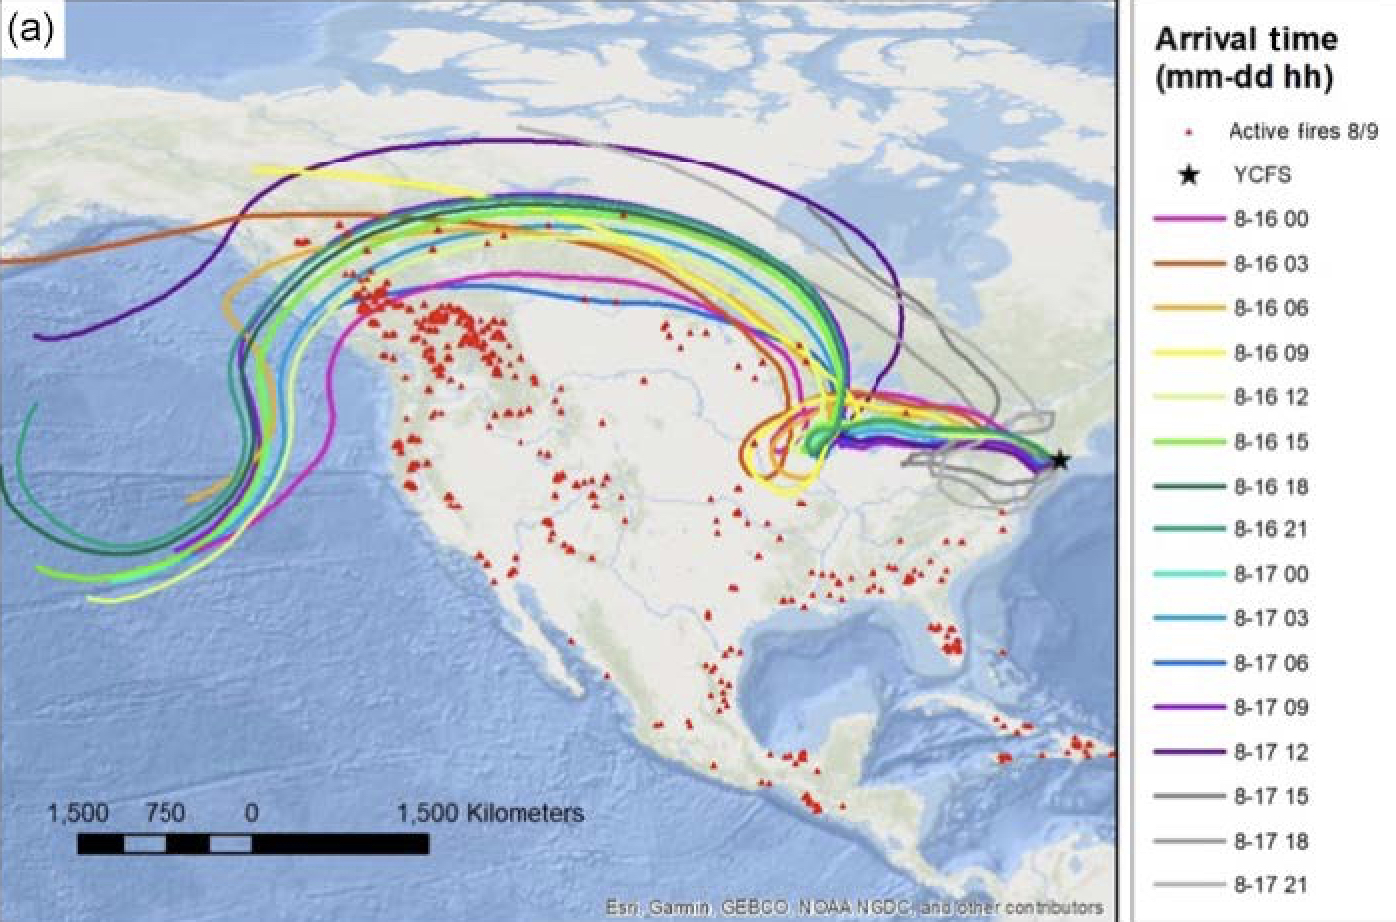
Backward-trajectory model of air that arrived at the Long Island Sound on August 16-17, 2018 . Each line represents the backward-trajectory for an air parcel arriving every three hours throughout the course of the day. The location of fires on August 9 (when most trajectories intersect the wildfire zone on the West Coast) is depicted with red triangles.
Credit: Rogers et al., Atmos. Chem. Phys., 2019
Related EGU articles
Download
- Original image (975.9 KB, 1396.0x922.0 px)
- Preview image (79.4 KB, 1280x845 px, JPEG format)