

Evolution of total glacier volume in the European Alps between 2003 and 2100
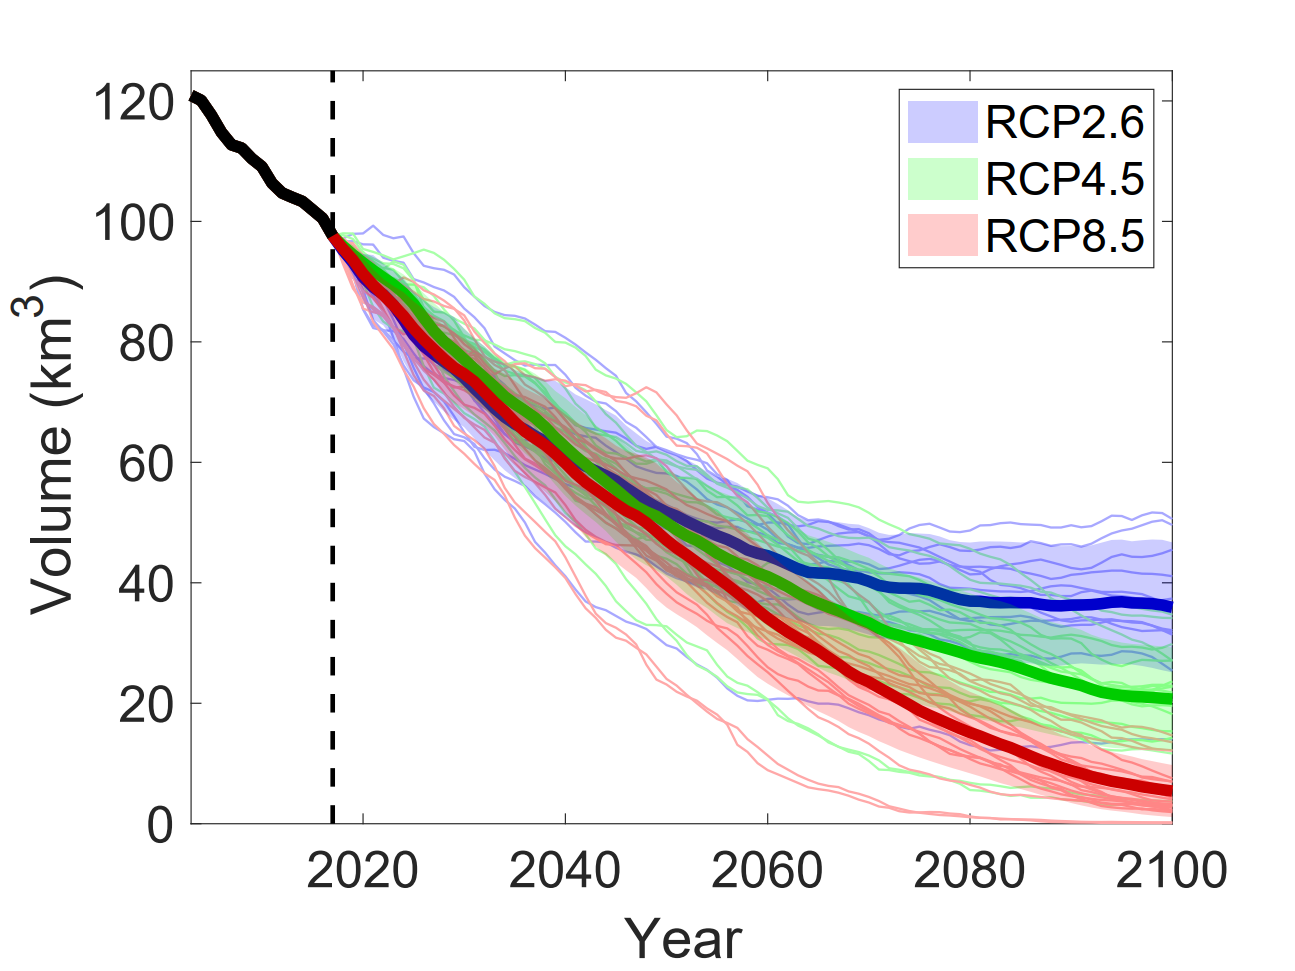
Thin lines represent glacier evolution for a given future climate simulation from the EURO-CORDEX ensemble (51 simulations are considered in total). The thick line is the mean from all simulations for a given RCP (representative concentration pathway), and the shaded area corresponds to the spread around this value. The dotted vertical line represents the year 2017.
Credit: Zekollari et al., 2019, The Cryosphere
Related EGU articles
Download
- Original image (271.8 KB, 1295.0x971.0 px)
- Preview image (57.3 KB, 1280x960 px, JPEG format)